Case study
Batik Nitik Classification
- Category
- Data / ML
- Period
- 2026
Graph-based spatial descriptors for 60-class Batik Nitik motif recognition
- Python
- scikit-learn
- OpenCV
- scikit-image
- NetworkX
- SciPy
- pandas
- Matplotlib
Context
Batik Nitik motifs are built out of dots: the identity of a motif is where the dots sit, how densely they cluster and how the clusters connect. The thesis — Improving Machine Learning Performance with Graph-Based Descriptors for Batik Nitik Image Classification — asks whether a descriptor built on that layout classifies motifs better than the texture descriptors used before it.
The dataset is 960 images across 60 motif classes, sixteen images per class, arriving as four groups of four augmented variants.
Problem
Texture descriptors — GLCM, MTCD, CMTH — summarise local pixel statistics. They capture grain and contrast, but not the spatial arrangement that separates one Nitik motif from another. Two motifs can look similar in texture statistics and still differ in where the dots are.
So the descriptor needs to encode structure, and the evaluation needs to show that any gain is real rather than an artefact of a leaky split.
Method
Five stages, each one a module in the repository:
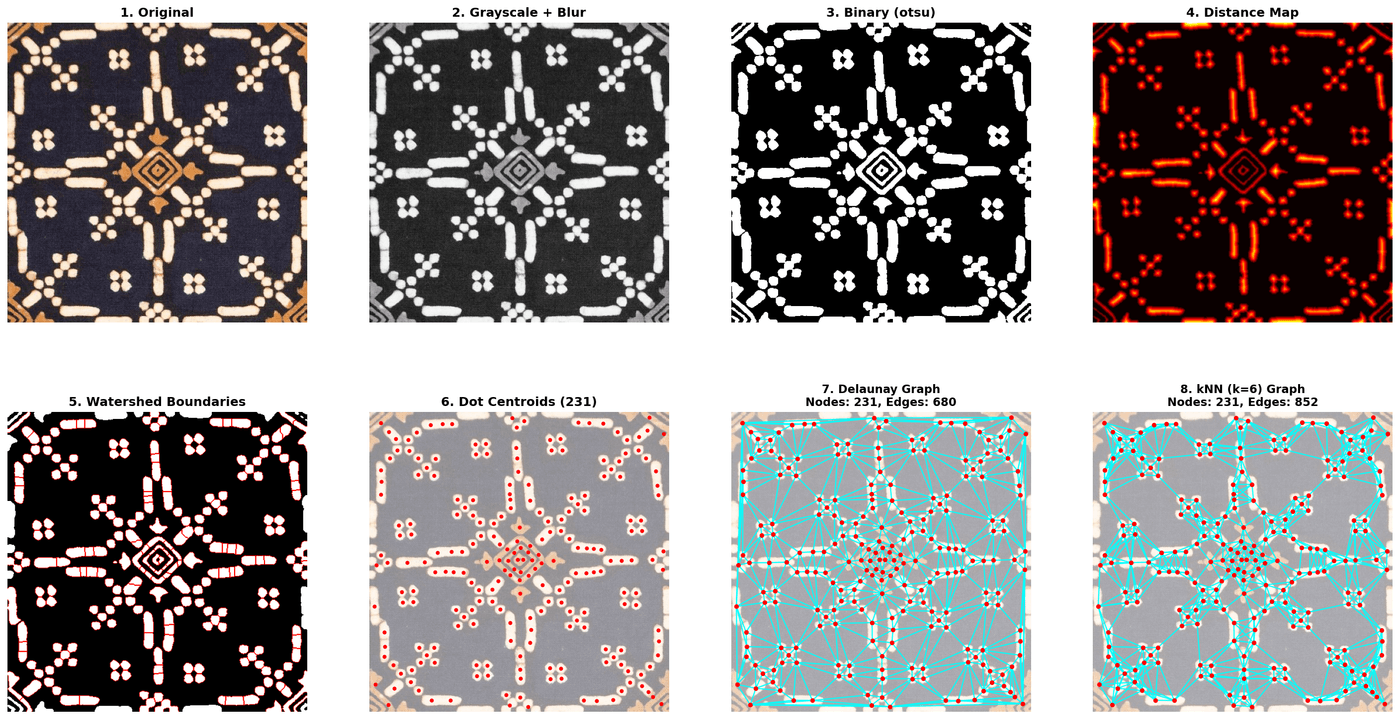
- Preprocess — resize to 512 px, grayscale, Gaussian blur, Otsu thresholding, morphological opening.
- Detect dots — distance transform, then peak detection at two scales so both dominant and small elements survive; watershed separates touching dots and regions under 50 px² are discarded. On the sample motif this yields 231 centroids.
- Build a graph — the centroids become nodes. Delaunay triangulation and kNN graphs for k = 2…10 are compared rather than one being assumed.
- Extract 28 features in three groups: 10 topology (nodes, edges, density, degree statistics, clustering), 10 edge-geometry (length distribution, skewness, kurtosis, range, coefficient of variation, IQR) and 8 Voronoi (cell area and vertex statistics).
- Classify — KNN (k = 1, 3, 5, 7, 9), SVM with an RBF kernel in a one-vs-rest wrapper, and a decision tree, all on scaled features.
Experiments
Three, in order, each one narrowing the next:
- Graph comparison. Ten graphs × seven classifiers on the full 28-feature set, scored on the validation split. kNN with k = 6 won on accuracy with F1 as the tie-breaker; SVM (RBF) reached 95% validation accuracy on it.
- Feature selection. An ANOVA F-test ranks the features and the configuration is chosen on validation macro-F1. The winner keeps 18 of the 28 features.
- Final comparison. The selected subset is evaluated once on the held-out test split, then set against the published baselines.
The split is 12:2:2 per class — 720 train, 120 validation, 120 test — and it is group-aware: three of the four augmented groups go whole into training, and the remaining group is split between validation and test. No augmented variant of a training image can appear on the evaluation side.
Results
With 18 features and KNN (k = 1):
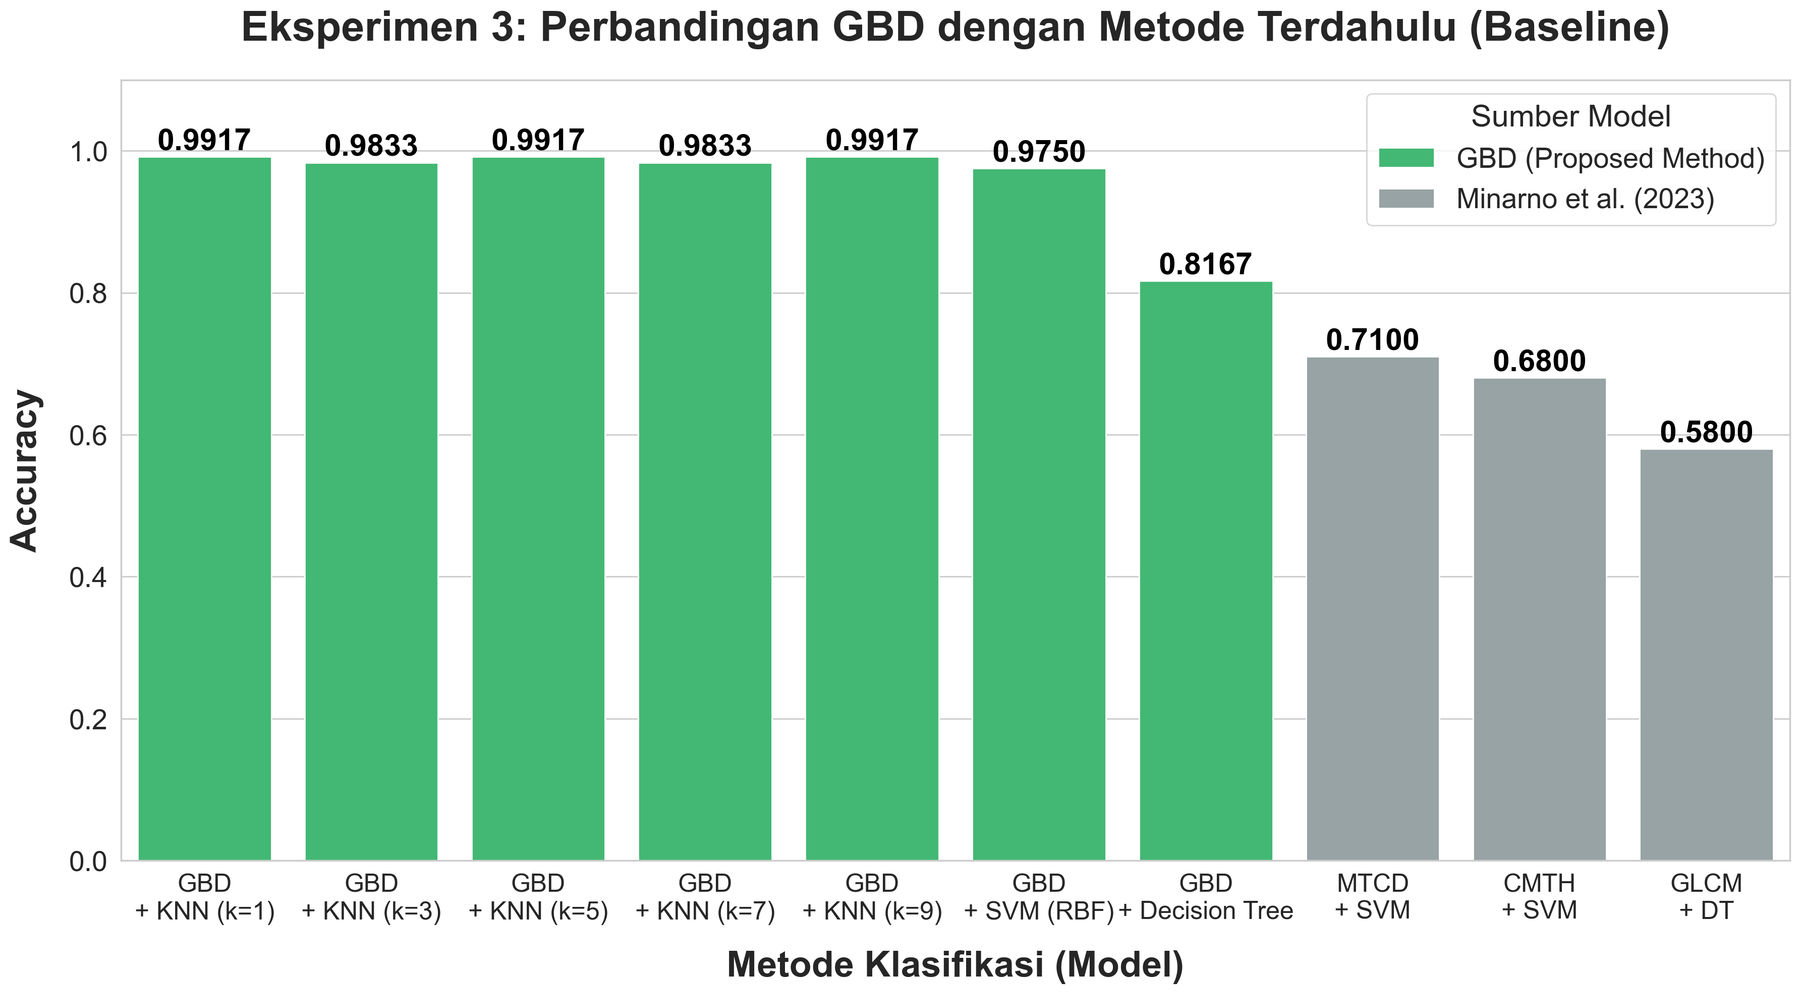
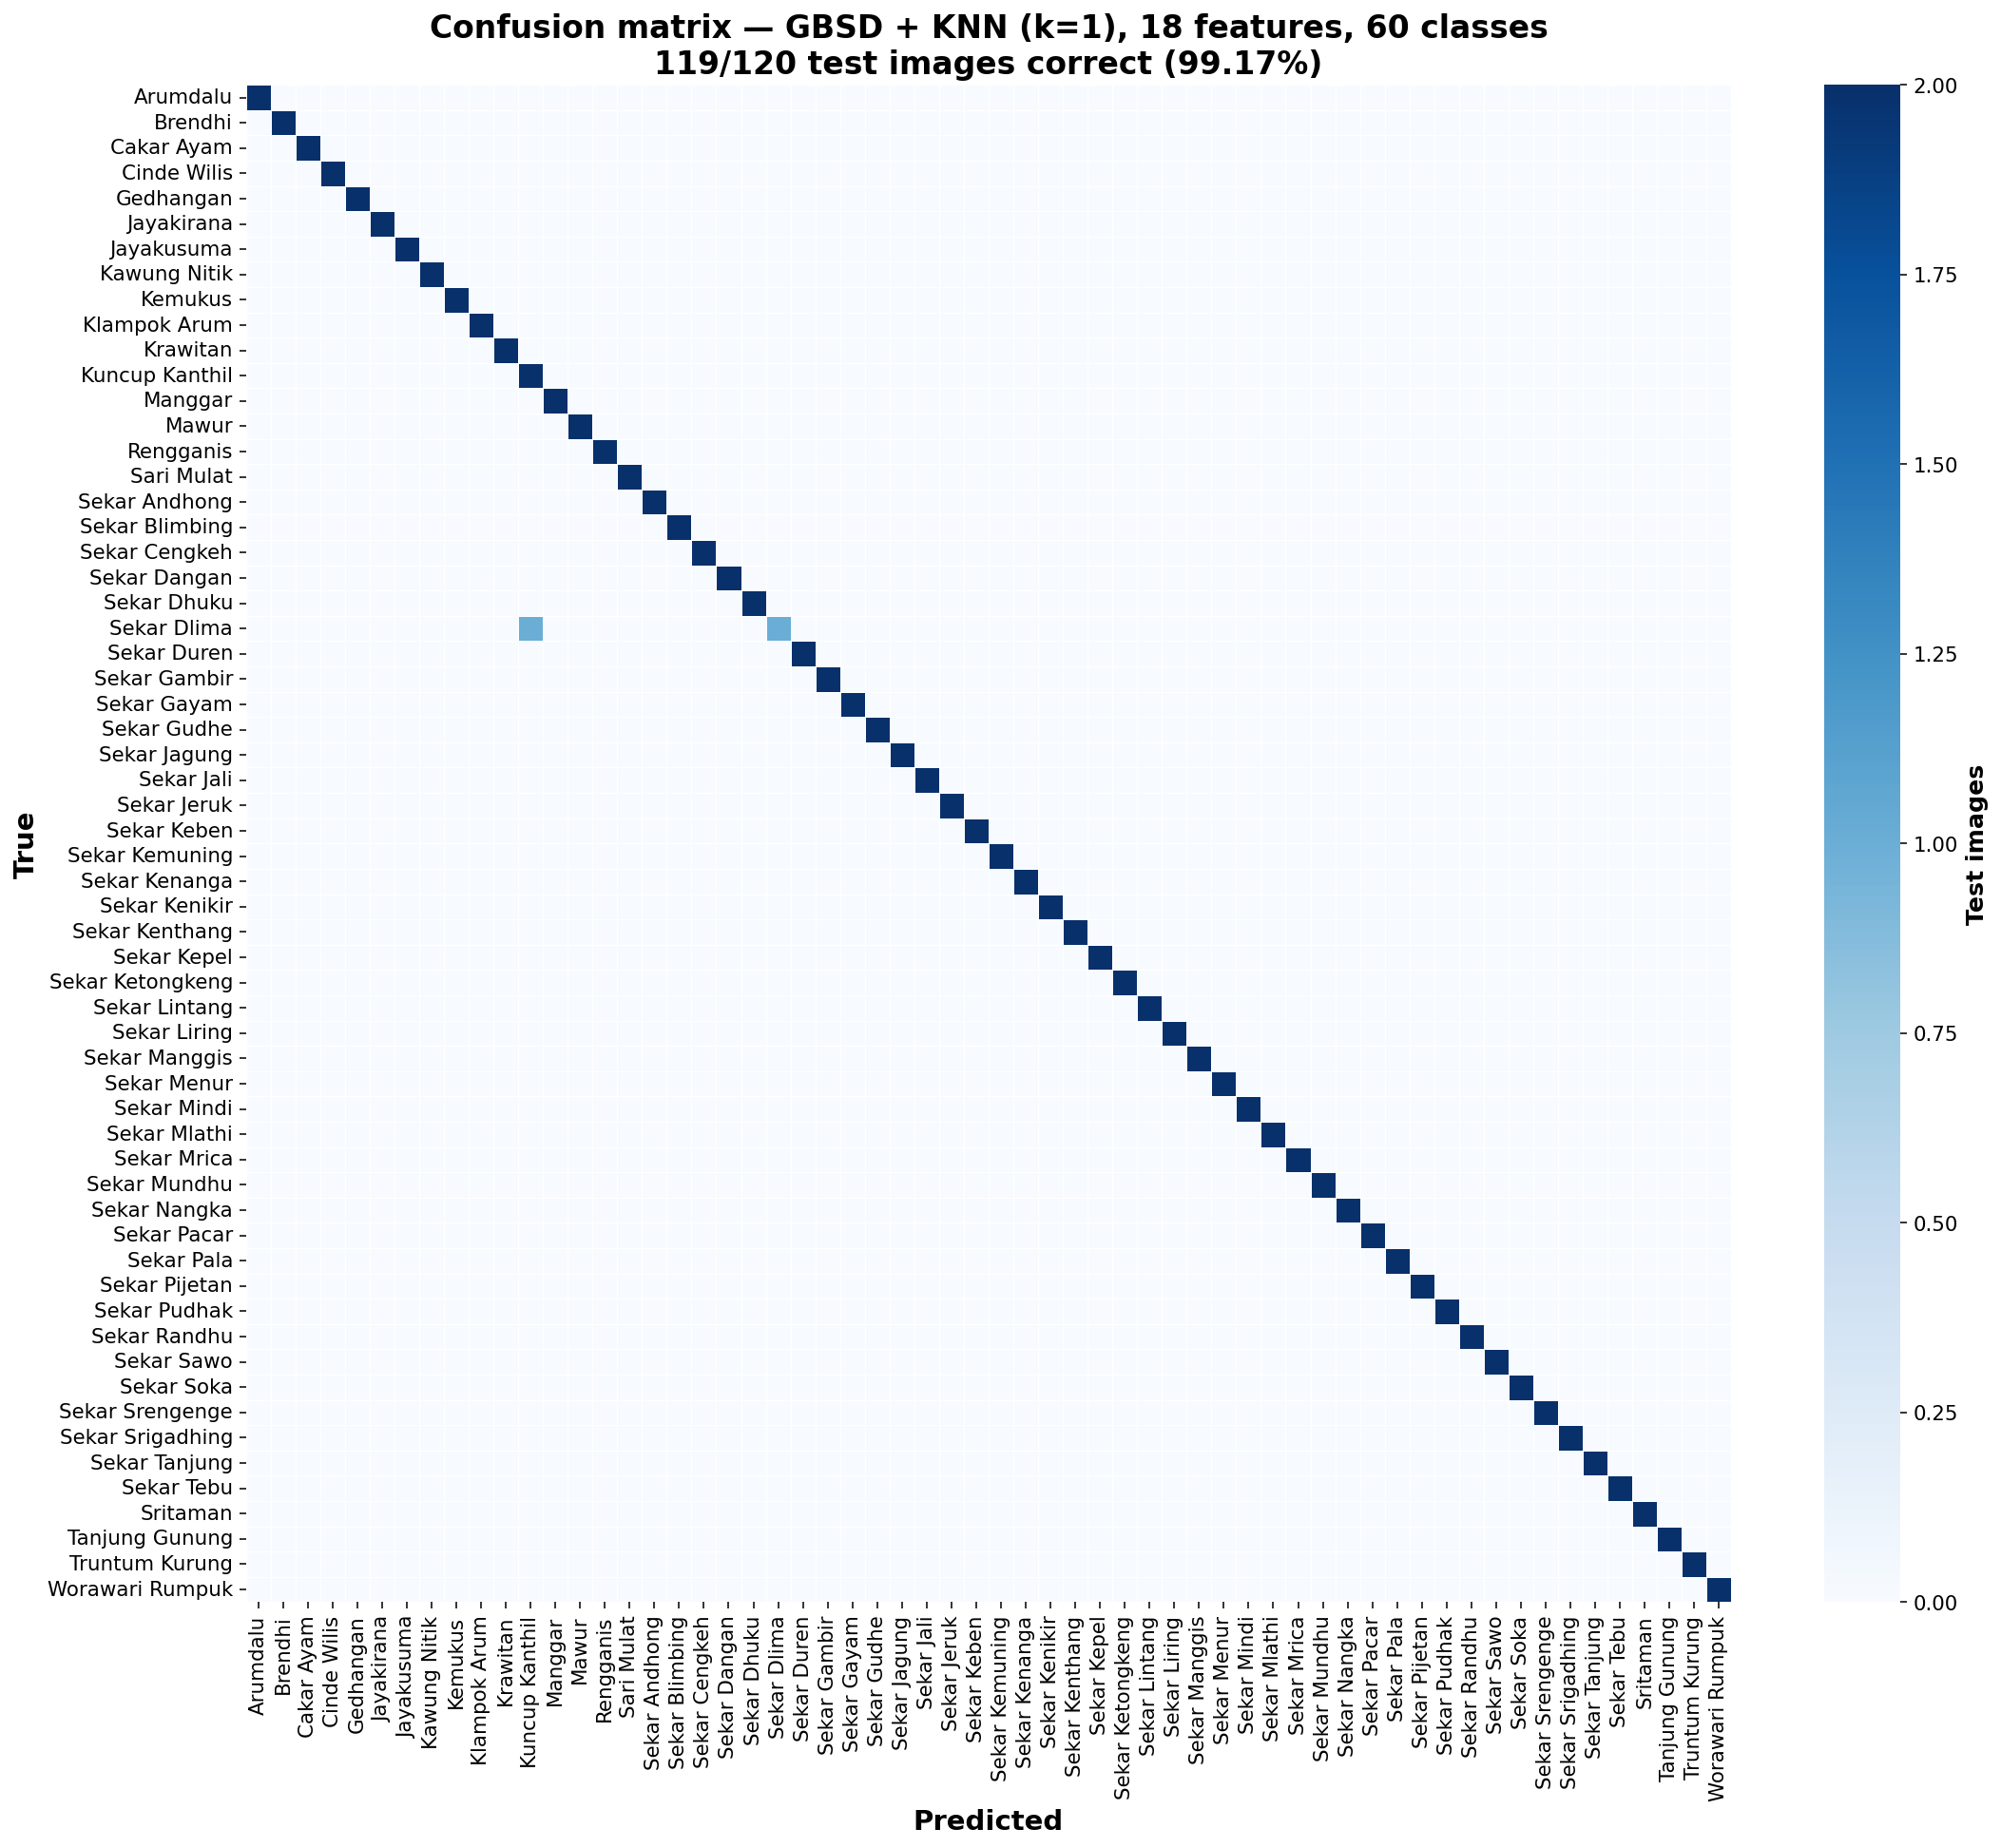
- Test accuracy — 99.17% (119 of 120)
- Macro F1 — 99.11%
- Macro precision — 99.44%
- Macro recall — 99.17%
KNN at k = 5 and k = 9 matches the accuracy; SVM (RBF) reaches 97.5% and the decision tree 81.67%. The quoted literature baselines are 71% for MTCD + SVM, 68% for CMTH + SVM and 58% for GLCM + decision tree.
One test image is wrong: a Sekar Dlima motif is classified as Kuncup Kanthil. The confusion matrix is the third figure below.
Limits
One image is 0.83 points. The test split has 120 images, so 99.17% means exactly one error. It is a strong result, but the granularity is coarse.
A single split, not cross-validation. The split is seeded and group-aware, but it is one split. Repeated splits or k-fold would say more about variance.
The baselines are quoted, not re-run. MTCD, CMTH and GLCM numbers come from Minarno et al. (2023). They were not reimplemented on this split, so the comparison is against published figures rather than a controlled head-to-head.
Sixteen images per class are not sixteen photographs. The four augmented groups share source images; the group-aware split stops that leaking into the evaluation, but the effective sample size is smaller than 960 suggests.