Case study
Premium Rice Price Forecasting
- Category
- Data / ML
- Period
- May 2024 – Jun 2024
Fuzzy time series forecasting of monthly mill-gate rice prices in West Java
- Python
- pyFTS
- pandas
- NumPy
- Streamlit
- Plotly
- Matplotlib
Context
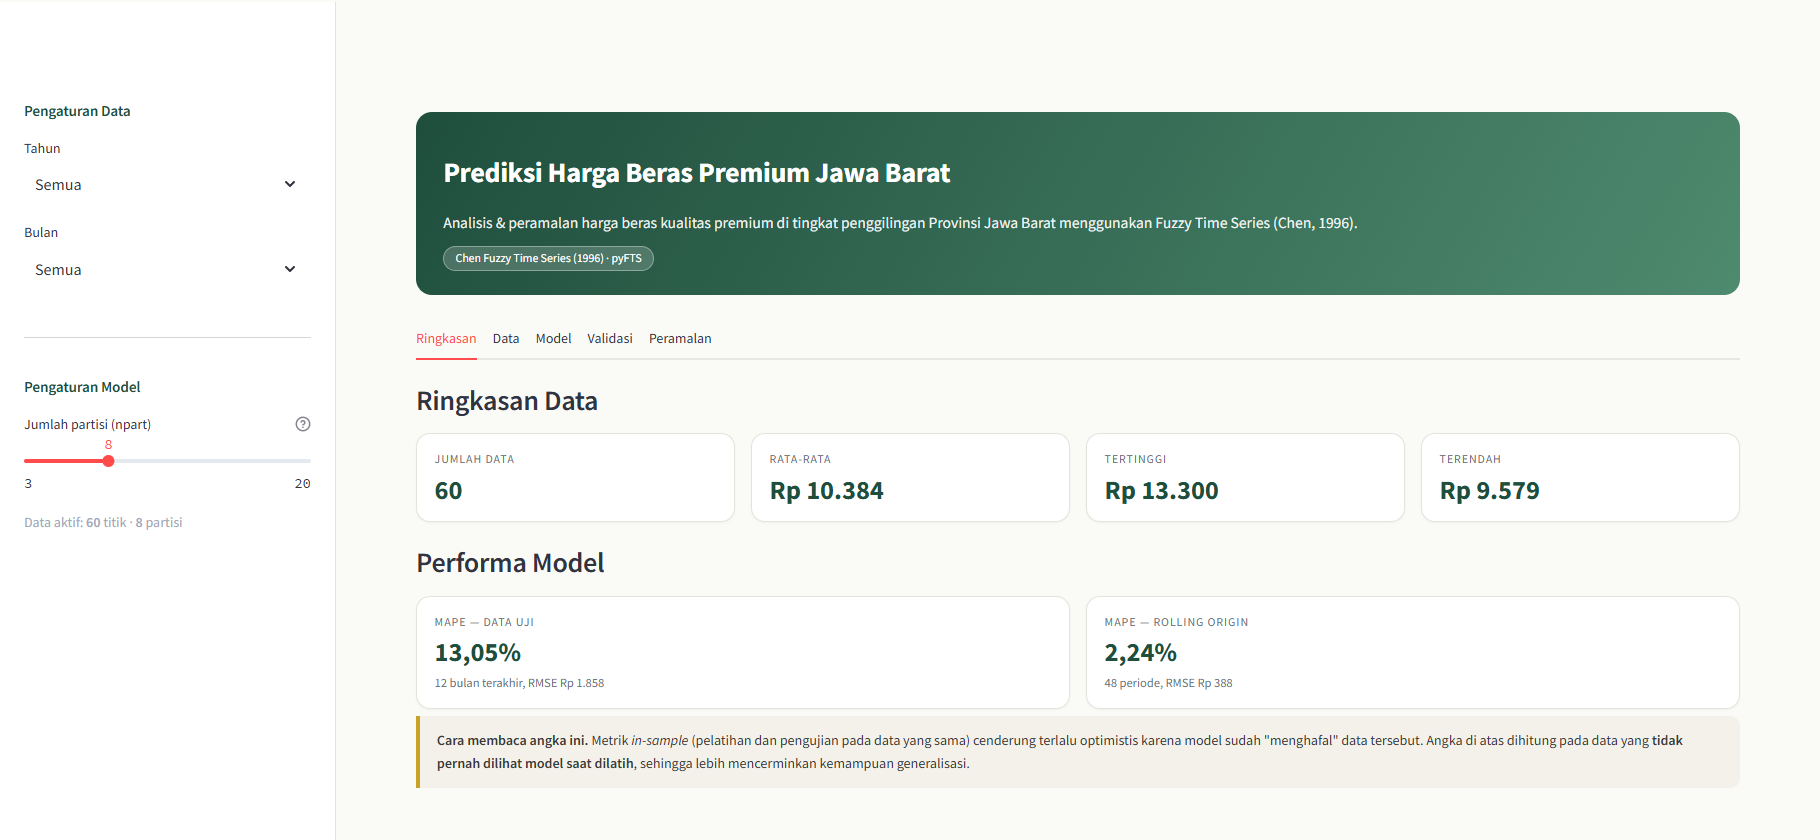
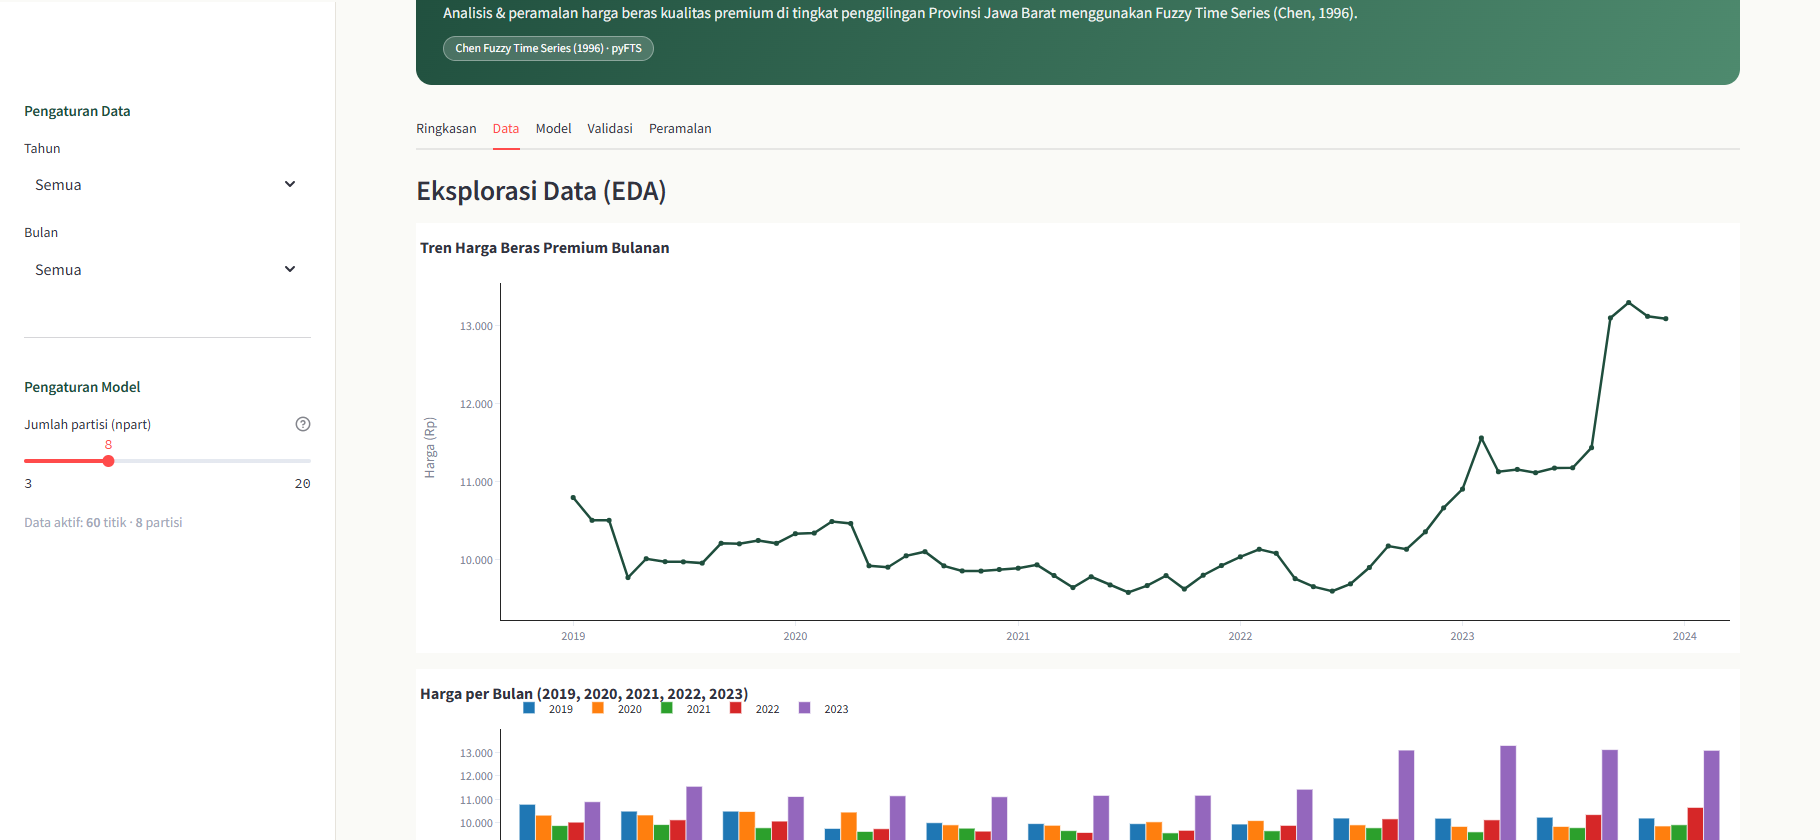
Premium rice prices at the mill gate move month to month, and the series is short: sixty monthly observations, January 2019 to December 2023. A forecasting method for that shape of data has to work with little history and stay explainable, because a number nobody can trace back to the series is not useful to whoever has to act on it.
This was coursework for an AI course, built as an application rather than a notebook: the model, the evaluation and the interface ship together.
Problem
Two problems, usually conflated:
- Forecasting. Given a monthly series of premium rice prices in West Java, project the next values without pretending the series is longer than it is.
- Evaluation. Report how well the model generalises, not how well it reproduces data it was fitted on. In-sample scores on a sixty-point series look excellent almost by construction.
The second problem is the one that decides whether the first is credible.
Method
Conventional Fuzzy Time Series after Chen (1996), first order, implemented
through pyFTS:
- Prices are fuzzified into fuzzy sets using a grid partition, so each observation belongs to a set with a degree rather than being snapped to a single bucket.
- Transitions between sets form a fuzzy logical relationship basis (FLRG) — the model's rules, written in terms of the series' own history.
- The next value is the midpoint of the defuzzified result set.
The number of partitions (npart) is the one real tuning knob: it controls how
finely the universe of discourse is cut. Too few and the model cannot separate
regimes; too many and the rule base fragments on sixty points. The application
therefore exposes npart as a curve rather than a magic constant, and pyFTS
rejects values below three outright.
Evaluation
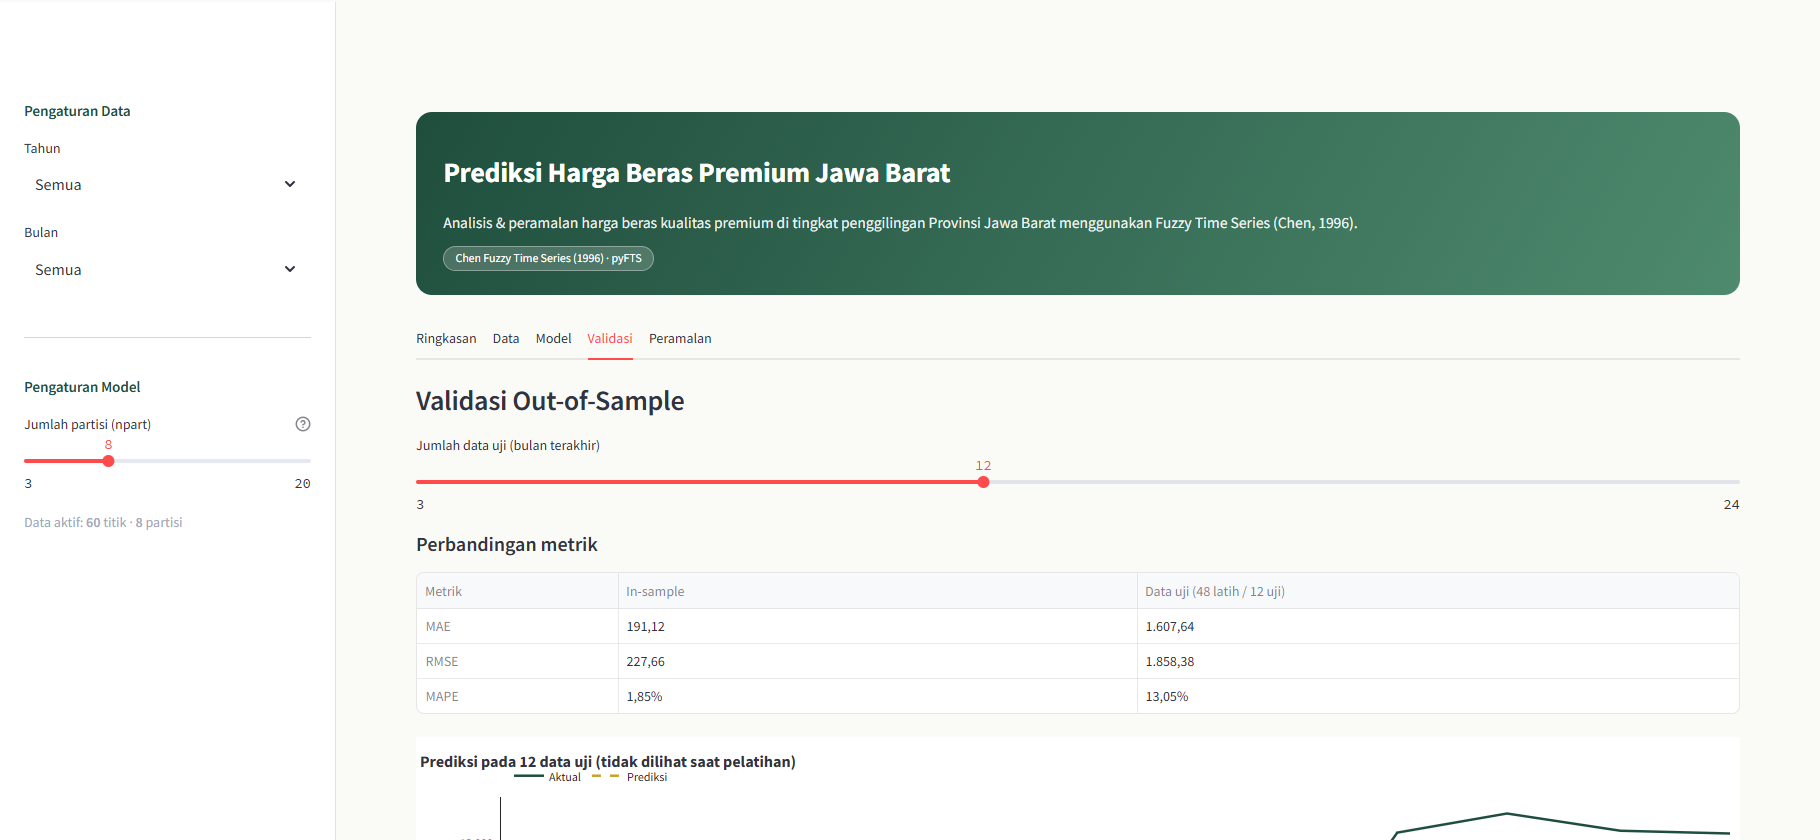
The validation tab is deliberately built around the distinction between in-sample and out-of-sample error:
- Temporal split — fit on the earlier part of the series, score on the later part, so the test set is genuinely unseen.
- Rolling-origin evaluation — repeatedly refit and forecast one step ahead, moving the origin forward, which is closer to how the model would be used than a single split.
- A tuning curve over
npart, so the choice of partition count is visible and defensible rather than asserted.
Error is reported as MAE, RMSE and MAPE. MAE and RMSE stay in rupiah, so the error is readable next to the price; MAPE gives a scale-free figure for comparison across partition counts.
At the default eight partitions the difference is not subtle: 1.85% MAPE in-sample against 13.05% on the held-out last twelve months, with MAE rising from Rp 191 to Rp 1,608. Rolling-origin evaluation over 48 one-step refits lands at 2.24% MAPE — easier, because each step is refitted immediately before it is scored. Quoting the 1.85% would have been the flattering choice.
Interface
A Streamlit dashboard with five tabs:
- Summary — dataset statistics and out-of-sample performance.
- Data — EDA: price trend, monthly bars, table, descriptive statistics.
- Model — fuzzy sets, partition detail, data distribution, FLRG rule base.
- Validation — in-sample versus test comparison, rolling-origin runs, the
nparttuning curve. - Forecast — forward projections, with CSV export.
Fuzzy sets are rendered with Matplotlib, the interactive charts with Plotly.
Prices follow Indonesian conventions throughout — thousands separated by a dot,
decimals by a comma, Rp 13.500,75 — which Plotly does not do natively, so the
axis and tooltip formatters are rewritten by hand.
Limits
Long-horizon forecasts flatten. Chen's first-order model reaches a fixed point: after the first step the projection is constant. That is a property of the method, not a bug in the implementation, so the forecast tab says so instead of presenting the flat line as a prediction.
Univariate and first order. The model sees one variable and one lag. Price drivers that are not in the series — supply, policy, seasonality beyond what the monthly values already encode — cannot influence the forecast.
Sixty points is sixty points. The out-of-sample numbers are honest about generalisation, but they are still measured on a short series, and a short series bounds how much confidence any of this deserves.
Implementation notes
pyFTS 1.6 predates numpy's removal of the np.int alias, so a compatibility
patch runs automatically before the library is imported — downgrading numpy was
not an option, since pre-1.24 releases have no wheels for Python 3.12. The app
is run from the repository root because the dataset is loaded by relative path.